

 GenoLens
Decode gene expression in minutes
GenoLens turns raw RNA-seq data into publication-ready insights. AI-powered analysis and interpretation, no bioinformatics expertise required.
Everything your lab needs
A complete transcriptomics workflow, from raw counts to biological meaning.
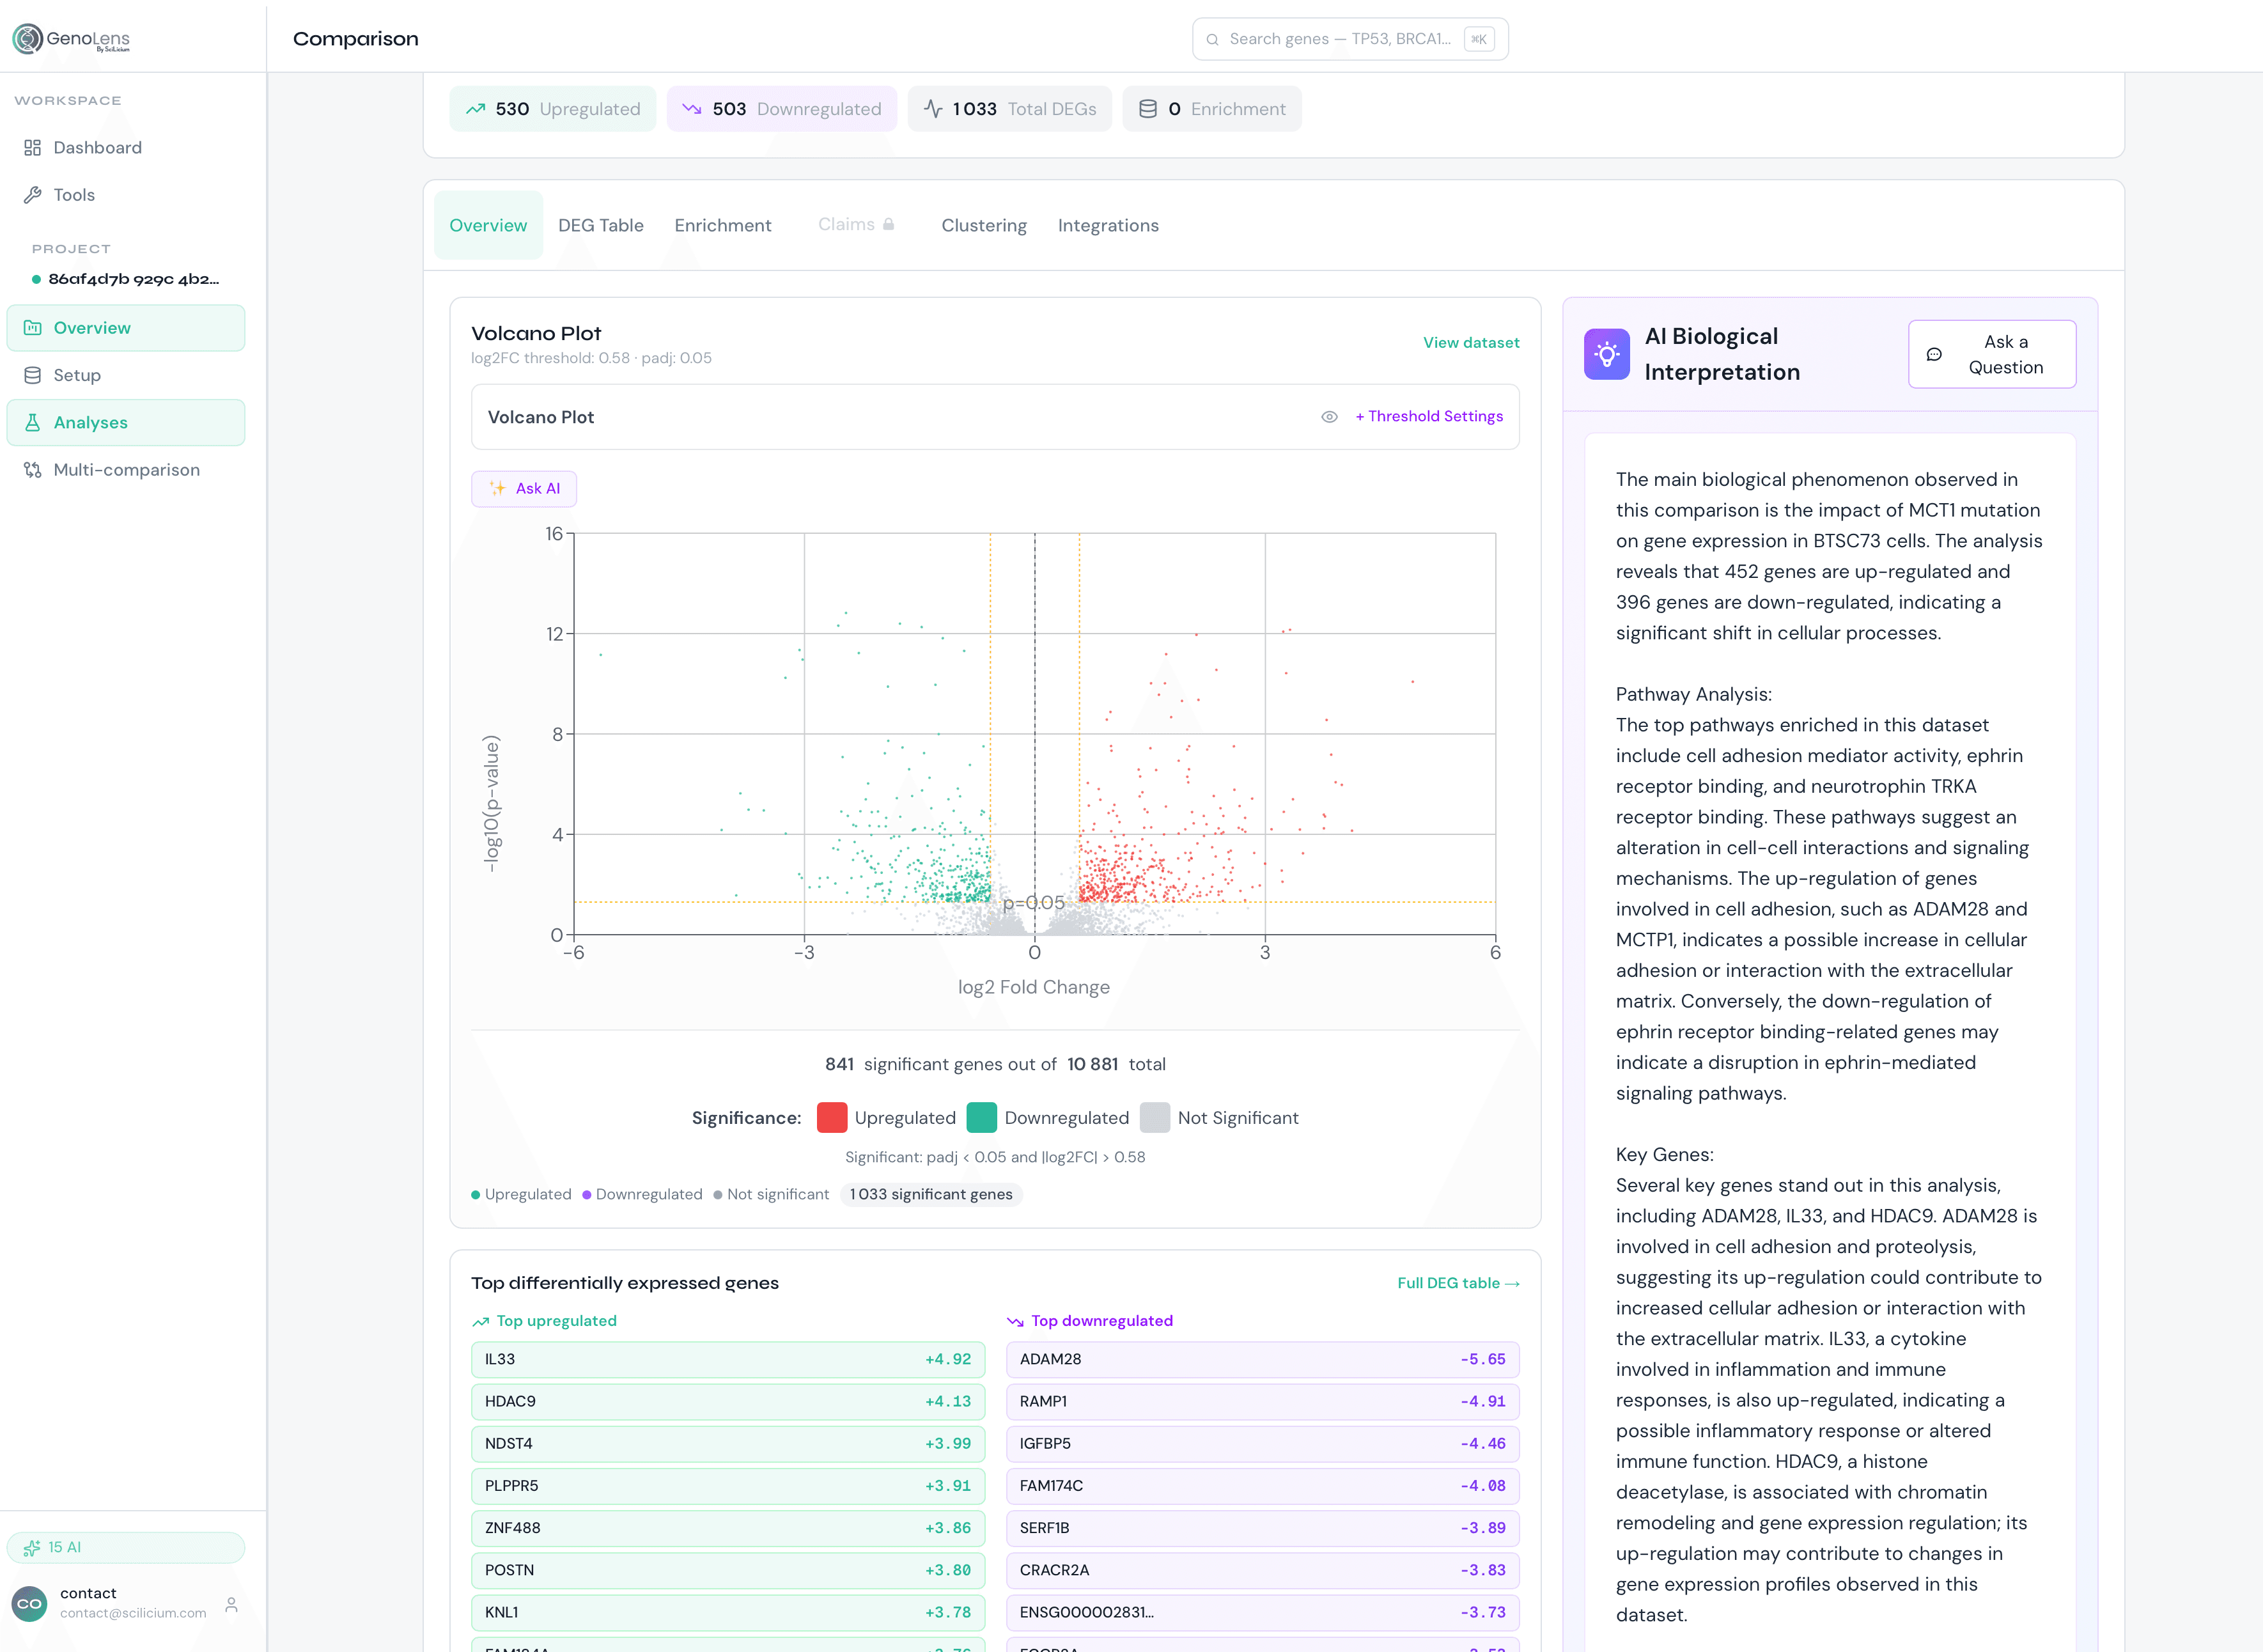
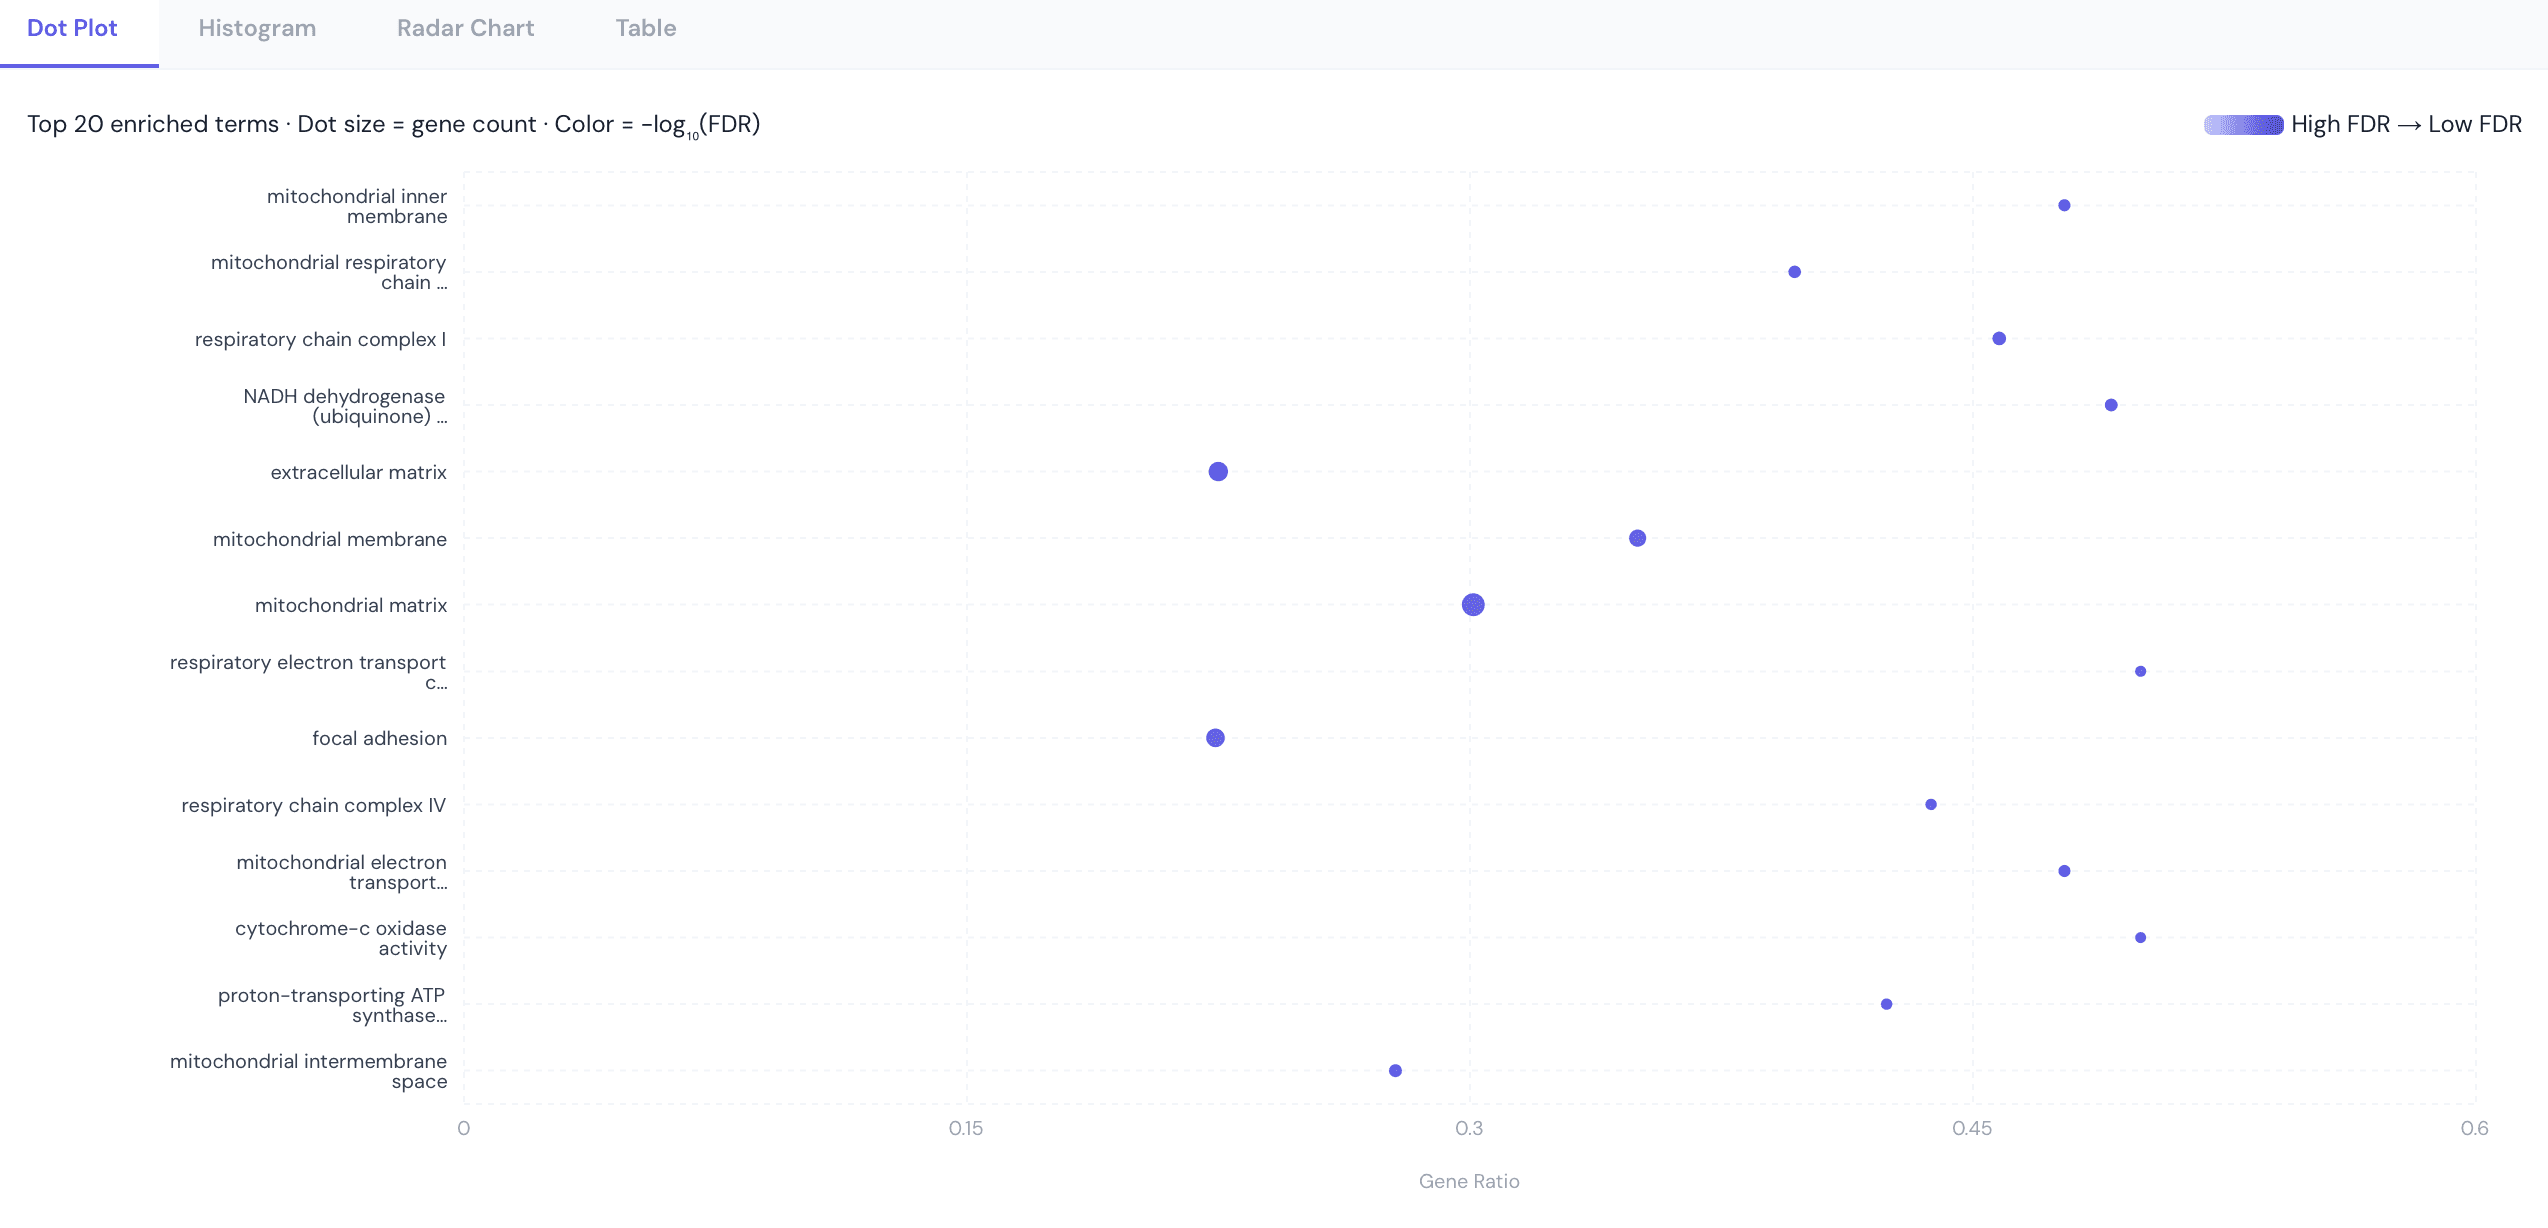
Interactive Visualizations
Volcano plots, heatmaps and dot plots, exportable as SVG/PNG at 300 DPI.
AI Interpretation
A custom LLM turns your results into structured biological narratives with mechanistic insight.
Automation & APIs
Cosmetics Module
Add-onDedicated readouts and endpoints for cosmetic efficacy and safety studies, tuned for skin biology.
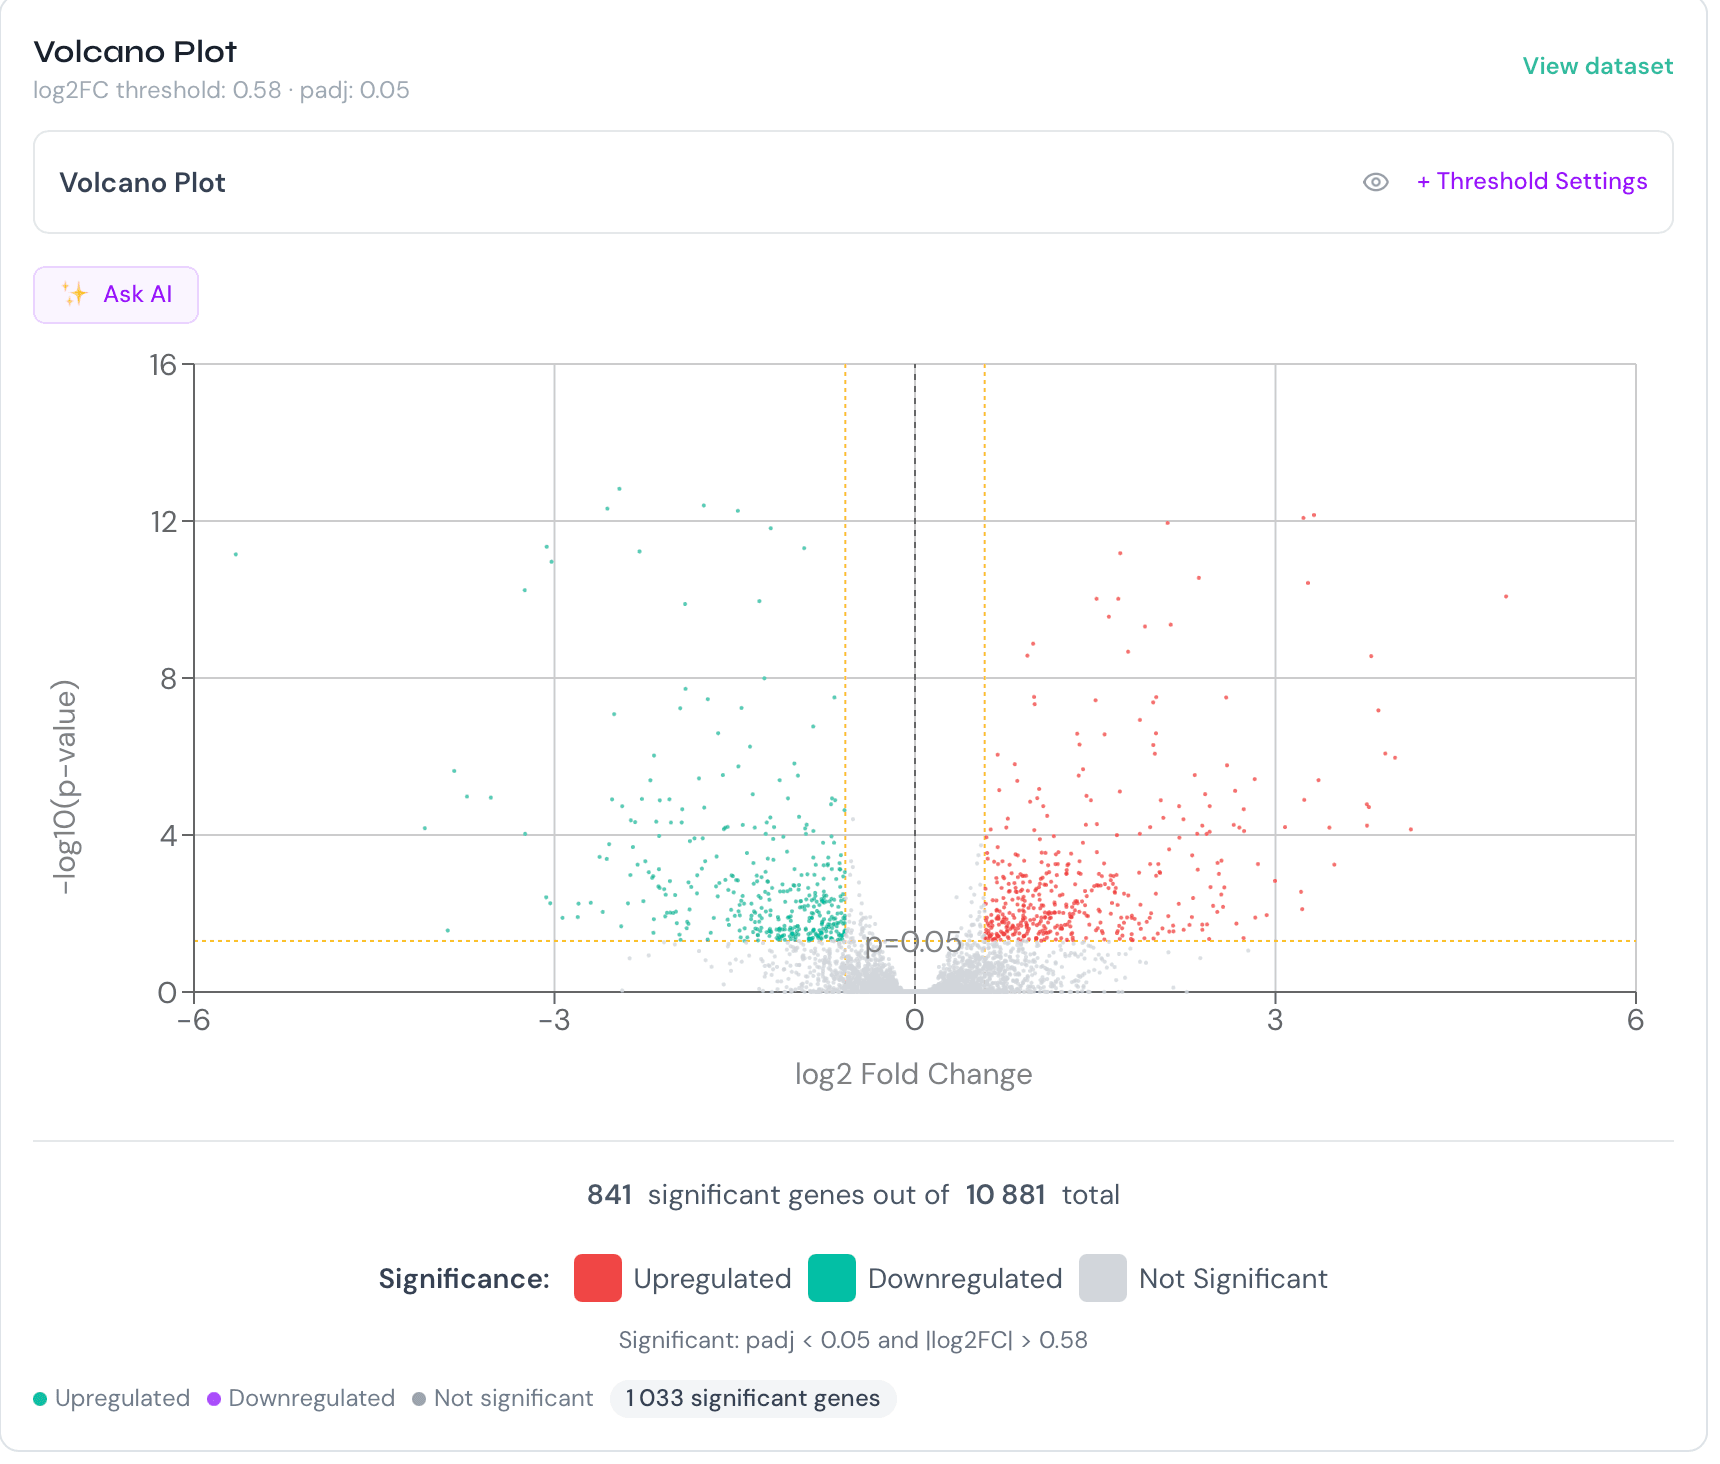
Differential Expression
DESeq2/EdgeR-equivalent pipeline with multi-group contrasts and FDR correction.
Clustering & Dim. Reduction
K-means, hierarchical clustering, PCA, UMAP and t-SNE.
Pathway Enrichment
GO, KEGG and Reactome analysis via Fisher's exact test and GSEA.
Custom PDF Reports
One-click branded, publication-ready PDF reports of your analysis.
From upload to publication in three steps
Follow the flow, GenoLens does the heavy lifting.
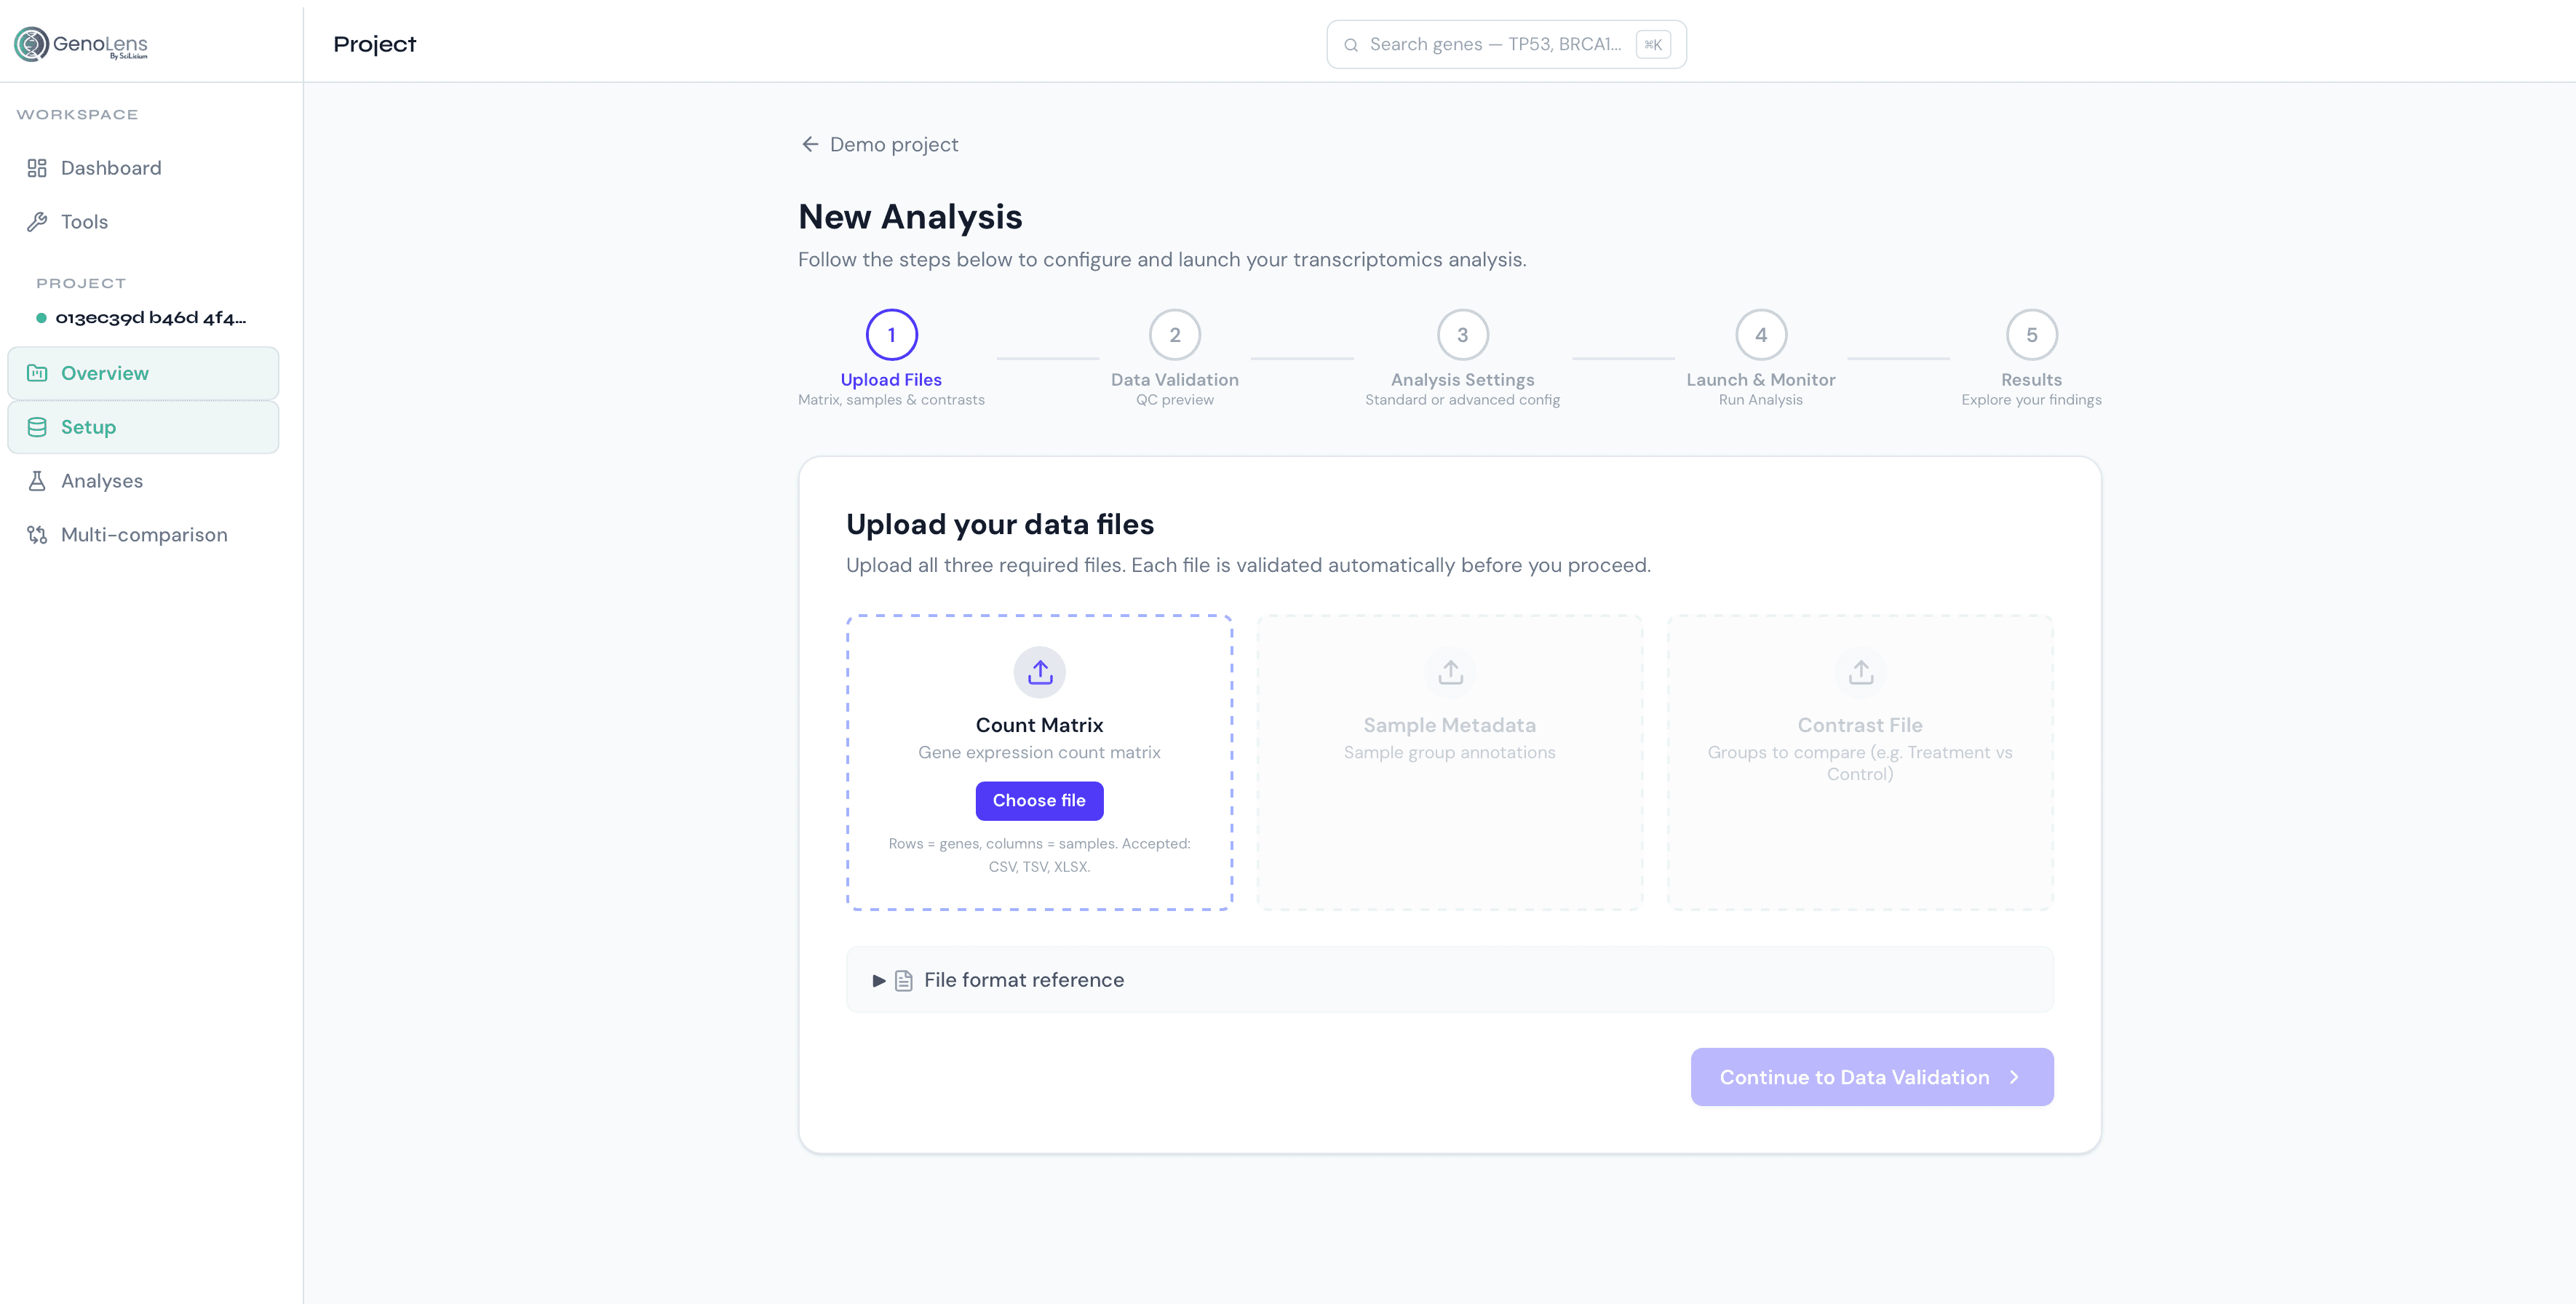
Upload Your Data
Drag-and-drop count matrix (CSV/TSV/XLSX) or API. GenoLens validates format, maps gene identifiers, converts to optimised Parquet.
Configure & Analyse
Define sample groups, normalisation, and analyses. DEG, clustering, and enrichment run concurrently via cloud task queue.
Explore & Interpret
Browse interactive dashboards, request AI narrative, export figures, share reproducible links with reviewers.
Ready to decode your data?
Start analysing your RNA-seq data with GenoLens today.